How Sustainable Materials Lower Your Carbon Footprint

How Sustainable Materials Lower Your Carbon Footprint
Every disposable plate, cup, and straw your restaurant uses carries a hidden cost: embedded carbon emissions. From raw material extraction to the moment packaging hits the trash, each item adds to your operation’s carbon footprint. The good news? You can influence that number. The materials you choose for foodservice packaging are one of the most direct ways to reduce that output. And the switch is simpler than you might think.
What Carbon Footprint Means for Packaging Materials
A carbon footprint measures the total greenhouse gas emissions tied to a product across its entire life. For a deeper look at how carbon footprints work in general, see our full explainer. But for packaging specifically, the story has a unique twist. According to the EPA’s analysis of material goods and U.S. emissions, the production and disposal of goods account for a significant share of national greenhouse gas output.
Foodservice packaging is high-volume and short-lived. Your restaurant might go through hundreds or thousands of disposable items every week. Each one is used for minutes before it’s discarded. That combination of massive quantity and brief use makes packaging a surprisingly large source of emissions for any food business. For a closer look at how carbon footprints are calculated and measured, our guide breaks down the methodology.
Two types of carbon matter here. Operational carbon is the energy your restaurant uses day to day: lighting, cooking, refrigeration. Embodied carbon is the emissions baked into a product before it ever reaches your door. For single-use items, embodied carbon dominates the equation. That means the biggest opportunity to cut emissions sits in your purchasing decisions, not your thermostat.

How Embodied Carbon Shapes Material Choices
Embodied carbon is the total greenhouse gas emissions generated during a product’s life before it reaches you. Think of it as the carbon “debt” a product carries from day one. A UNEP report on material production and carbon impact highlights how raw material processing is one of the largest contributors to global emissions.
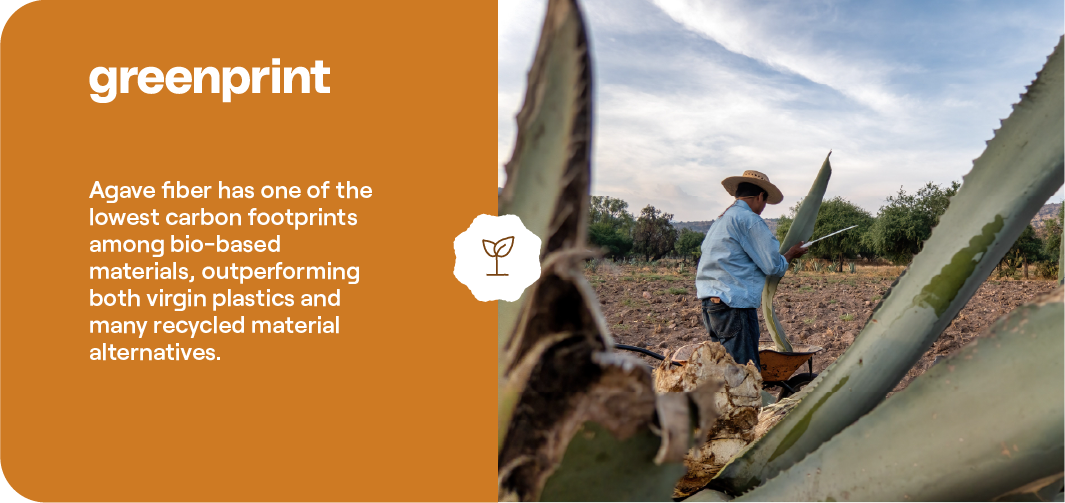
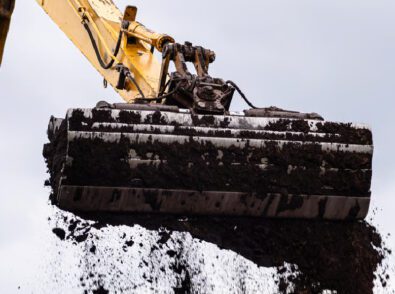
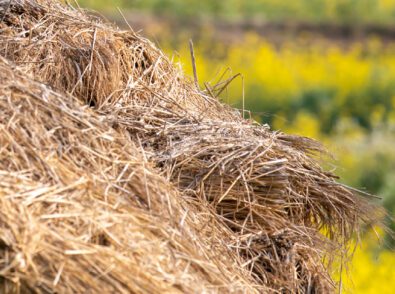
It starts with extracting raw materials. Drilling for petroleum to make plastic is carbon-intensive. Harvesting agricultural waste like sugarcane bagasse or agave fiber? Much less so. Understanding agave fiber’s material composition and properties shows why waste-derived feedstocks carry a lower carbon baseline. Then comes manufacturing. Melting, molding, and forming packaging requires energy, and the source of that energy matters. Transportation from factory to distributor to your restaurant adds more. And end-of-life processing, whether that’s landfill, incineration, recycling, or composting, contributes the final piece.
For disposable foodservice packaging, embodied carbon is the defining metric. Unlike a building or a vehicle, a single-use plate has no “use phase” where energy efficiency can offset manufacturing emissions. What went into making it is what it costs the climate, full stop.
This is why material selection carries outsized weight for restaurant operators. Carbon intensity per unit varies dramatically depending on the raw material and how it’s manufactured. That’s the emissions generated to produce one plate or one cup. A foam clamshell and a bagasse clamshell serve the same function at your counter. But the emissions behind each one can be vastly different.
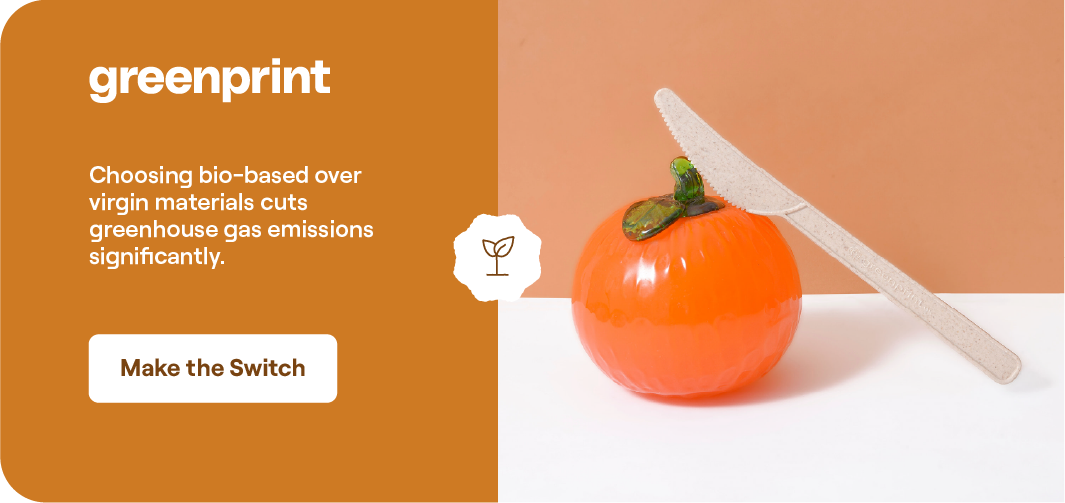
Switching from a high-carbon material to a lower-carbon alternative can deliver meaningful reductions across your total packaging footprint. Multiply the per-unit savings by the thousands of items your restaurant moves each month, and the impact adds up fast.
How Common Foodservice Materials Compare on Carbon Impact
Plastics, Paper, Compostable Fiber, and Foam Side by Side
Not all disposable packaging materials carry the same carbon load. Here’s a directional look at how common foodservice materials stack up. Keep in mind: exact numbers depend on the specific product, manufacturer, and region. These are general rankings based on published research and LCA trends, not precise figures.
Highest carbon intensity:
-
Expanded polystyrene (EPS) foam. Petroleum-derived, energy-intensive to produce, and rarely recyclable in practice.
-
Virgin PET plastic. Requires fossil fuel extraction and high-heat manufacturing.
Moderate carbon intensity:
-
Virgin paperboard. Comes from tree pulp, which stores carbon, but bleaching and processing add emissions.
-
Standard PLA (polylactic acid). Plant-derived, but industrial manufacturing still consumes significant energy. Learn more about PLA plastic sourcing and composting requirements.
Lower carbon intensity:
-
Recycled paperboard. Avoids the emissions of virgin pulp production.
-
Bagasse (sugarcane fiber). Uses agricultural waste as a feedstock, sidestepping extraction emissions.
-
Molded fiber from post-consumer recycled content. Repurposes existing materials with less energy input.
-
Agave-based compounds. Uses agricultural waste fiber with a shorter, regional supply chain.
A few important notes on what shifts these rankings.
Recycled content consistently lowers carbon intensity. When a manufacturer uses recycled paperboard instead of virgin pulp, it skips the logging, pulping, and bleaching steps. That means less energy and fewer emissions per finished product.
Transport distance matters. A product shipped across an ocean carries more embedded carbon than one manufactured regionally. If two products are otherwise similar, the one made closer to your restaurant wins on carbon.
The local energy grid makes a difference. A factory powered partly by wind energy produces lower-carbon goods than one running entirely on fossil fuels. This is one reason to ask suppliers about their manufacturing energy mix.
End-of-life pathways count too. A product designed for home composting avoids the methane that organic materials generate when buried in a landfill. For more on how home and industrial composting pathways differ, see our composting guide.
Want to see how PLA, PHA, and bagasse compare against each other? See our detailed bioplastic comparison.
How Life Cycle Assessment Measures True Material Impact
If you’re comparing packaging materials, a life cycle assessment (LCA) is the most reliable tool available. An LCA doesn’t just look at one phase of a product’s life. It tracks environmental impact from start to finish. For a detailed explanation of how LCAs work, see our full guide.
Here’s what an LCA examines for something like a compostable plate:
-
Raw material sourcing. Where does the feedstock come from? Is it virgin fossil fuel, agricultural waste, or recycled content? Agave fiber or sugarcane bagasse starts with a lower baseline than petroleum.
-
Manufacturing. How much energy does production require, and what powers the facility? A plant running partly on wind energy generates fewer emissions per unit than one relying entirely on natural gas.
-
Distribution. How far does the finished product travel? Regional manufacturing shortens the supply chain and cuts transport emissions.
-
End of life. Does the product go to a landfill, get recycled, or break down through composting? Each pathway carries different carbon consequences. Home composting returns organic material to soil without generating methane. Landfilling, by contrast, produces methane over time.
Here’s why this matters for your purchasing decisions. When a supplier says their product is “lower carbon,” the claim should be backed by LCA data. Otherwise, it’s a guess.
Not all LCAs are created equal. A credible LCA uses third-party data, follows ISO 14040 life cycle assessment standards, and discloses its assumptions. Some LCAs only measure “cradle to gate” (raw material to factory exit) and skip transport and end-of-life entirely. Others cover the full “cradle to grave” picture. The scope changes the results.
When evaluating suppliers, ask two questions. First, does the carbon data come from a published, peer-reviewed LCA or from internal estimates? Second, does the LCA cover all four stages, including end of life? The answers tell you whether you’re comparing real data or marketing claims.
How To Reduce Carbon Footprint Through Packaging Choices
You don’t need to overhaul your entire operation overnight. Small, targeted changes to your packaging lineup can add up to meaningful carbon reductions over time. Here are five practical steps, ranked roughly by impact.
-
Replace fossil-fuel-based items with plant-derived or recycled alternatives. Start with your highest-volume items. If you go through thousands of plastic cups or foam containers each month, switching those to compostable or recycled-content options delivers the biggest per-unit savings.
-
Right-size your packaging. Oversized containers waste material and add unnecessary carbon. Match container size to portion size.
-
Source from suppliers with verified carbon data. Ask your distributor or manufacturer for third-party LCA data or carbon intensity figures. Suppliers who can show their numbers are more likely to deliver genuinely lower-carbon products.
-
Consolidate shipments and work with regional suppliers. Fewer deliveries and shorter transport distances mean less fuel burned. A manufacturer closer to your market reduces your embedded transport emissions.
-
Prioritize composting-compatible materials. Products designed for composting, especially home composting, avoid the methane emissions that organic materials generate when buried in a landfill. Look for TÜV Austria OK Compost HOME certified compostable packaging when sourcing your disposables.
None of these steps require a sustainability team or a big budget. They’re purchasing decisions you’re already making. You’re just making them with carbon in mind. For more restaurant-level strategies for reducing environmental impact, we’ve compiled a broader set of actionable tips.
At Greenprint®, we’ve built our supply chain around these principles. We source agave fiber from existing agricultural waste streams and compound it in-house. Our manufacturing facility runs approximately 40% on wind energy. That vertical integration cuts unnecessary steps and lowers the carbon load on every product we ship. Our certified compostable packaging, including plates, bowls, cutlery, cups, clamshells, and straws, is PFAS-free across all verified product lines. Ready to see how lower-carbon packaging fits your operation? Explore our certified compostable plates and bowls. Or contact our team for help picking the right products.
Frequently Asked Questions
What Material Has the Highest Carbon Footprint?
For foodservice packaging, EPS foam and virgin petroleum-based plastics like PET typically carry the highest embodied carbon. Both rely on fossil fuel extraction and energy-intensive manufacturing processes.
How Does Compostable Packaging Compare to Plastic on Carbon Emissions?
Compostable packaging made from plant-based feedstocks generally produces fewer manufacturing emissions than conventional petroleum-based plastic. The raw material stage is the main driver: growing plants captures carbon, while extracting oil releases it. However, the full comparison depends on end-of-life handling, since composting and landfilling have different carbon outcomes. For a cup-specific breakdown, see our detailed comparison.
What Is the Simplest Way for a Restaurant To Lower Packaging Carbon Footprint?
Start by identifying your highest-volume disposable items. These are usually cups, containers, or straws. Replace those first with compostable or recycled-content alternatives for the largest per-unit carbon savings. Then right-size your packaging to eliminate waste, and ask your suppliers for verified carbon data on the products you buy.
PLA only breaks down in industrial composting facilities at 55-60°C. Learn why standard PLA cannot home compost and what BPI certification means for your operation.
Learn how agricultural waste material innovation turns crop residues like sugarcane bagasse and agave fiber into compostable foodservice packaging with third-party certification.

What does upcycled mean in packaging? Learn how upcycled packaging transforms waste into higher-value products, how it differs from recycling, and what to look for when choosing it.